User guide › Dashboards & reports
The dashboard
Dashboard is the workspace home page — a grid of widgets sitting over your live records. Nothing on it is a nightly snapshot: the widgets read the same data the rest of the app does, so a deal closed two minutes ago is already in the count.
A workspace can have more than one. Dashboards are ordinary pages, so a business can run a sales overview, an operations board and a finance summary side by side and put each one in front of the people who need it.
Edit mode
Edit in the top bar switches the current page into edit mode. The sidebar folds away, a Widgets palette opens on the left and a Properties panel opens on the right when a widget is selected. Done takes you back.
Click a widget in the palette to drop it on the grid, drag it by its handle to move it, and resize from the corner. The grid is twelve columns wide and widgets snap to it, so a row of four stat cards lines up without any fiddling.
Properties is where a widget gets pointed at something: which entity supplies the data, which view to borrow, an optional filter, and — for a stat card — which aggregation to run. Filters are per-widget, so two stat cards can read the same entity and count different things.
The widgets
| Widget | What it shows |
|---|---|
| Stat card | One number. A count of records, or the sum, average, min or max of a numeric field. Takes an icon and a caption line. |
| Table | An inline grid of records — just the data, none of the page chrome. |
| Kanban | Cards grouped by a select field. Needs a board view on the entity to borrow from. |
| Chart | One chart from an entity's chart view. |
| Entity view | The whole entity page embedded, view tabs and all. Heavy — most cases want Table or Kanban. |
| SLA at risk | Cross-entity SLA monitor: what has breached, what is about to. |
| My pending approvals | Records across every entity waiting on your decision. |
| Heading / Divider | Section chrome, so a long dashboard reads in blocks rather than as one wall. |
The palette also carries record-scoped widgets — a single field, a pipeline bar, related records, comments, reminders, an SLA gauge, an approval card. Those need a record to read from, so they belong on a record's profile rather than a dashboard.
KPIs and goals
A stat card shows a number. A goal shows a number with a target attached, and remembers whether you're hitting it.
Each goal aggregates one entity's records — count, sum, average, min, max or ratio — over a period, and compares the result against a threshold. The period can be all time, a rolling window of N days, or the current week, month, quarter or year. The threshold carries a direction, so "at least 20 deals this month" and "no more than 5 incidents this week" are both expressible. An optional warning percentage makes a goal turn amber before it turns red.
Goals live on Goals & KPIs, grouped into whatever categories you name. Each one renders as a card with its current value, its target, a progress bar and a status — On track, Warning, Breached or No data — plus when it was last evaluated.
The server re-evaluates every enabled goal hourly. Admins get a re-evaluate button on each card for the moment right after an edit, when waiting an hour to see whether you got the threshold right is annoying. Everyone else can read the page — knowing what the team is measured on shouldn't require admin rights.
Sector templates are pre-shaped goals — deals closed this month, pipeline value, CSAT, first-call resolution, orders shipped per day, overdue receivables, active headcount, MQLs and more. Pick one, point it at an entity, adjust the target.
A goal aggregates across many records — "how is the team doing this month". An SLA is a clock on one record — "this ticket must get a reply within four hours". They answer different questions, and most workspaces that use one end up wanting both.
SLA at risk
Once entities have SLAs running, the SLA at risk widget is where you watch them all at once. The header counts what's breached and what's in warning; underneath is the list of the most at-risk records — the record, its entity, which target is in trouble, and either how long it's overdue or how much time is left.
Clicking a row opens that record, which is the point: the widget is a work queue, not a chart. It refreshes about once a minute, and it can be scoped to specific entities or left to watch every entity that has an SLA.
Scheduled reports
Dashboards need someone to look at them. A scheduled report doesn't — it renders on a cadence and mails the people on its list.
- Name it and pick an entity The report is built from that entity's records.
- Choose a format PDF or CSV.
- Set a schedule Presets cover every day at 8 AM, every Monday at 9 AM, the 1st of each month and every hour. Anything else takes a cron expression, and the page translates the common ones back into plain English so you can check yourself.
- Add recipients One email address per line. They don't have to be workspace members — an accountant or an investor can be on the list.
Saved reports list with their format, entity, cadence and last run. View renders the report against current data and opens it in a new tab, which is how you check the output before trusting the schedule. Run now fires one immediately without disturbing the next scheduled run — useful right before a board meeting. Clearing Enabled pauses a report without deleting it or its run history.
A schedule that fires at 8 AM daily will happily send the wrong thing every day. Use Run now once and read what arrives before you leave it alone.
Where these live
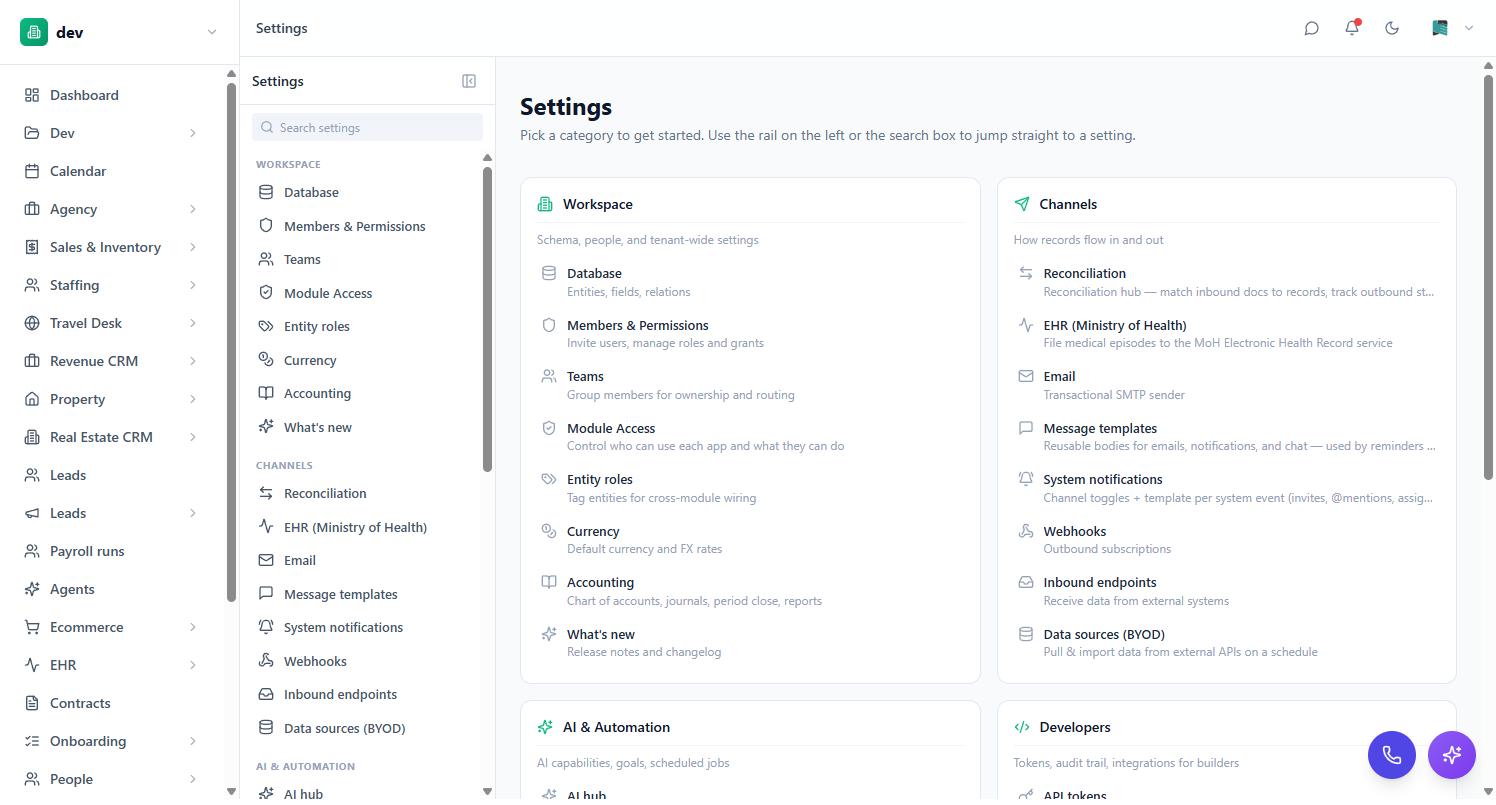
Editing a dashboard's widgets requires admin rights, as does creating, editing or deleting goals. Scheduled reports are admin-only end to end — members don't see the page at all.
New pages, including extra dashboards, are added under Settings → Database on the Navigation tab, which is also where you decide where they sit in the sidebar. See Entities & fields.